ProteoLens
A visual analytic tool for multi-scale database-driven biological network data mining
Abstract
Background
New systems biology studies require researchers to understand how interplay among myriads of biomolecular entities is orchestrated in order to achieve high-level cellular and physiological functions. Many software tools have been developed in the past decade to help researchers visually navigate large networks of biomolecular interactions with built-in template-based query capabilities. To further advance researchers’ ability to interrogate global physiological states of cells through multi-scale visual network explorations, new visualization software tools still need to be developed to empower the analysis. A robust visual data analysis platform driven by database management systems to perform bi-directional data processing-to-visualizations with declarative querying capabilities is needed.
Results
We developed ProteoLens as a JAVA-based visual analytic software tool for creating, annotating and exploring multi-scale biological networks. It supports direct database connectivity to either Oracle or PostgreSQL database tables/views, on which SQL statements using both Data Definition Languages (DDL) and Data Manipulation languages (DML) may be specified. The robust query languages embedded directly within the visualization software help users to bring their network data into a visualization context for annotation and exploration. ProteoLens supports graph/network represented data in standard Graph Modeling Language (GML) formats, and this enables interoperation with a wide range of other visual layout tools. The architectural design of ProteoLens enables the de-coupling of complex network data visualization tasks into two distinct phases: 1) creating network data association rules, which are mapping rules between network node IDs or edge IDs and data attributes such as functional annotations, expression levels, scores, synonyms, descriptions etc; 2) applying network data association rules to build the network and perform the visual annotation of graph nodes and edges according to associated data values. We demonstrated the advantages of these new capabilities through three biological network visualization case studies: human disease association network, drug-target interaction network and protein-peptide mapping network.

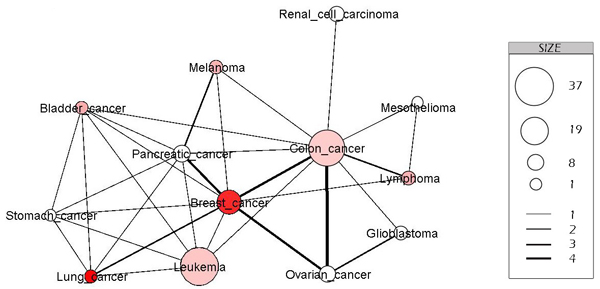
Figure 1 Disease-disease association network. This is a sub network of the cancer disease association network, built by retrieving 13 kinds of popular cancer. In this representation, the node is a kind of cancer, and if two kinds of cancer have common genetic disorder genes, there is an edge connecting them. The size of nodes indicates the number of cancerogenic disorder genes and the color of nodes indicates the number of cases in 2007 in the U.S; dark red indicates more cases, light red indicates less number, and white indicates less statistic data. The width of edge indicates the number of common genetic disorder genes of two kinds of cancer disease.
Conclusion
The architectural design of ProteoLens makes it suitable for bioinformatics expert data analysts who are experienced with relational database management to perform large-scale integrated network visual explorations. ProteoLens is a promising visual analytic platform that will facilitate knowledge discoveries in future network and systems biology studies.
How to cite us
Huan, T., Sivachenko, A. Y., Harrison, S. H., & Chen, J. Y. (2008). ProteoLens: a visual analytic tool for multi-scale database-driven biological network data mining. BMC bioinformatics, 9 Suppl 9(Suppl 9), S5. doi