Navigating through SEAS
Embedding
Embedding is a key element for SEAS to have good results. The user may choose either tSNE or umap algorithm to embed the sample if the user does not prepare the embedding input file. Still, we encourage the user to prepare and examine the embedding before analyzing using SEAS carefully.
Exploring data (optional)
SEAS allows users to visualize the clinical feature relations through grouped bar plots and scatter plots. upon uploading the dataset SEAS automatically identifies the data type of each clinotype in the dataset and places them in respective suitable plots. Linear Model Prediction is also added inside the scatter plot to visualize the correlation between two clinotypes.
Subcohort selection
SEAS support the following ways to select the subcohort:
- Box selection: the user draw a bounding box that covers some samples in the embedding visualization. SEAS would recognize the samples inside the box as the subcohort.
- Neighbor-point selection: in the embedding visualization, the user chooses a sample as the center and a radius. This defines a circle. SEAS would recognize all sample points inside the circle as the subcohort.
- Entering sample selection: the user can enter the list of sample identifiers into a box to define a subcohort.
Understanding the result
SEAS presents the enrichment result in a table, typically as follow:
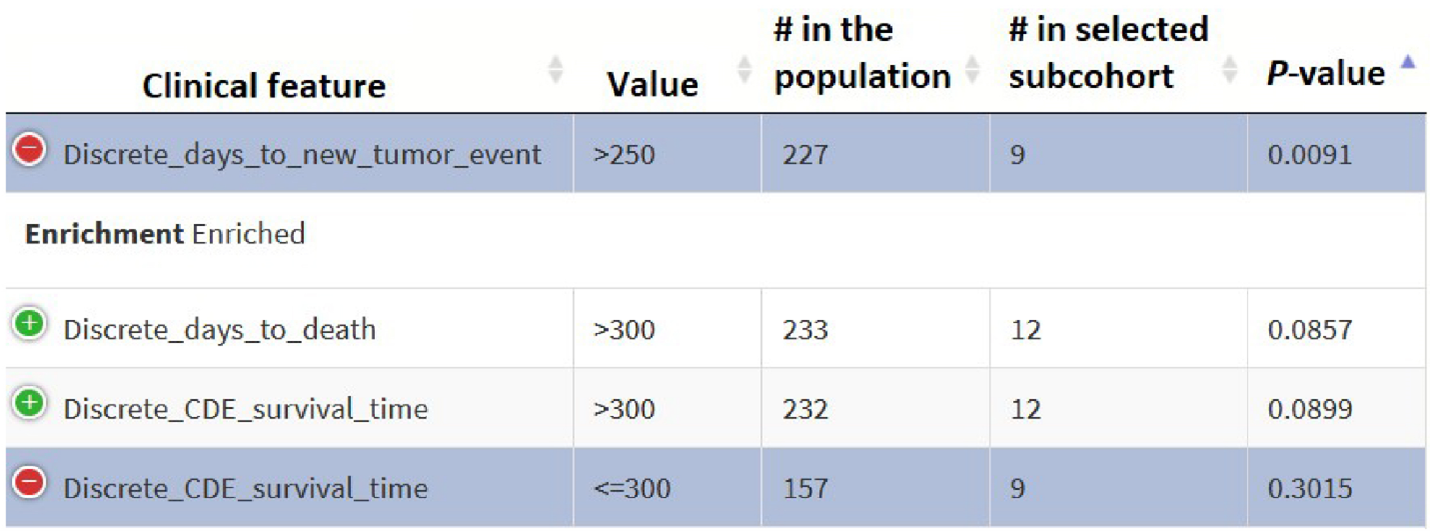
- The first column is the feature name. The second feature is the value. For example, the figure about shows ‘Discrete_days_to_death > 300‘ (outcome: the patient survive for more than 300 days)
- ’# in the population’: the number of samples that have clinical outcomes defined by the previous two columns in the whole population.
- ’# in the selected cohort’: the number of samples that have the clinical outcome defined by the previous two columns in the selected subcohort
- p-value: the result of statistical test for clinical enrichment. The smaller p-value is, the more likely the clinical outcome is prevalent in the selected subcohort.